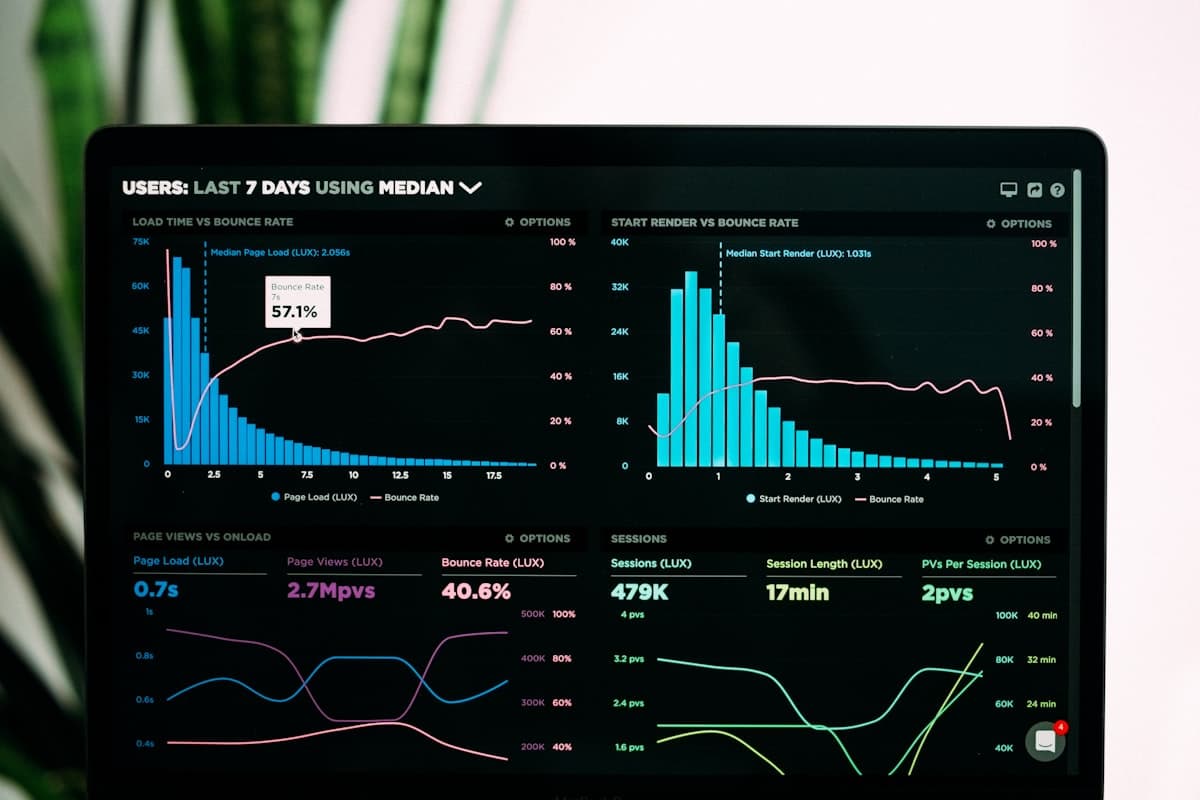
Choosing the right types of business intelligence for your organisation is one of the most consequential data decisions a modern enterprise makes. Business intelligence (BI) is not a single tool or dashboard — it is a spectrum of approaches, each answering a different question, serving a different audience, and demanding a different level of data maturity. Understanding these types helps Indian enterprises invest in the right capabilities at the right time, rather than buying expensive analytics platforms that gather dust.
This guide breaks business intelligence into two practical dimensions: the analytics maturity dimension (descriptive, diagnostic, predictive, prescriptive) and the delivery style dimension (operational, strategic, self-service, embedded, and mobile BI). We will explain each with real business examples, when to use it, and the tools typically involved — then look at how artificial intelligence is reshaping the entire field.
What Is Business Intelligence?
Business intelligence is the combination of technologies, processes, and practices that turn raw data into actionable insight for decision-making. It covers data collection, storage, cleaning, modelling, analysis, and visualisation. According to analyst firm Gartner , BI encompasses the applications, infrastructure, tools, and best practices that enable access to and analysis of information to improve and optimise decisions and performance.
In practice, BI answers questions like: Which products are selling in Tier-2 cities? Why did churn spike last quarter? Which customers are most likely to renew? What discount should we offer to close this deal? Each of those questions maps to a different type of business intelligence.
Types of Business Intelligence by Analytics Maturity
The most widely used framework classifies the types of business intelligence by analytical depth — often called the analytics maturity curve. As you climb the curve, insight becomes more valuable but also more technically demanding.
| Type | Question Answered | Complexity | Business Value | Typical Output |
|---|---|---|---|---|
| **Descriptive** | What happened? | Low | Foundational | Dashboards, reports |
| **Diagnostic** | Why did it happen? | Medium | Explanatory | Drill-downs, root-cause views |
| **Predictive** | What will happen? | High | Forward-looking | Forecasts, risk scores |
| **Prescriptive** | What should we do? | Very high | Decision-ready | Recommendations, actions |
1. Descriptive Analytics — What Happened
Descriptive analytics is the foundation of all business intelligence. It summarises historical data into readable reports, dashboards, and KPIs so teams understand past performance.
- Example: A Mumbai-based retail chain reviews a dashboard showing ₹4.2 crore in monthly revenue, with a regional breakdown across Maharashtra, Karnataka, and Tamil Nadu.
- When to use it: Always. Every organisation needs reliable descriptive reporting before attempting anything more advanced.
- Typical tools: Microsoft Power BI, Tableau, Looker, Google Data Studio, and standard SQL reporting.
Descriptive BI answers what but never why — which is where diagnostic analytics begins.
2. Diagnostic Analytics — Why It Happened
Diagnostic analytics digs into the causes behind trends. Through drill-downs, data mining, correlation analysis, and comparisons, it explains the story behind the numbers.
- Example: After noticing a 15% dip in Q3 sales, a manufacturer drills into the data and finds the decline is concentrated in one distribution zone affected by a supply delay.
- When to use it: When you need to understand root causes before reacting — investigating anomalies, performance gaps, or unexpected results.
- Typical tools: Power BI with drill-through, Tableau, OLAP cubes, and statistical exploration in Python or R.
Diagnostic BI is investigative. It turns a surprising number into an understood one, setting the stage for prediction.
3. Predictive Analytics — What Will Happen
Predictive analytics uses historical data, statistical models, and machine learning to forecast future outcomes. Instead of looking backward, it estimates what is likely to happen next and assigns probabilities.
- Example: A fintech lender in Bengaluru scores loan applicants on default risk, or an e-commerce firm predicts which customers are likely to churn in the next 60 days.
- When to use it: When you have clean historical data and want to anticipate demand, risk, churn, or revenue rather than merely report it.
- Typical tools: Azure Machine Learning, Amazon SageMaker, Python (scikit-learn, TensorFlow), and BI platforms with built-in forecasting.
Predictive BI carries real business weight because it enables proactive decisions — but it requires disciplined data engineering to be trustworthy.
4. Prescriptive Analytics — What Should We Do
Prescriptive analytics is the most advanced type of business intelligence. It goes beyond forecasting to recommend specific actions, often using optimisation, simulation, and AI to weigh trade-offs.
- Example: A logistics company receives a recommendation to reroute shipments through an alternate hub to cut delivery time by 18 hours while keeping fuel costs within budget.
- When to use it: For high-stakes, repeatable decisions where the optimal choice depends on many interacting variables — pricing, routing, inventory, or resource allocation.
- Typical tools: Optimisation engines, IBM Decision Optimization, custom AI models, and prescriptive modules within enterprise analytics suites.
Research by firms such as McKinsey suggests that organisations embedding advanced analytics into core decisions tend to outperform peers on speed and consistency of execution, though results vary widely by industry and data maturity.
Types of Business Intelligence by Delivery Style
Analytics maturity describes how deep the analysis goes. But BI is also classified by how it is delivered and consumed — the second key dimension of the types of business intelligence. Two organisations might both use predictive analytics, yet deliver it in completely different ways.
Operational (Real-Time) BI
Operational BI delivers live or near-live data to frontline teams so they can act in the moment. It emphasises speed and freshness over historical depth.
- Example: A quick-commerce warehouse in Delhi monitors a real-time dashboard of order flow, rider availability, and stock-outs, adjusting dispatch as conditions change minute by minute.
- When to use it: For time-sensitive operations — supply chain, customer support, fraud detection, and manufacturing floors.
- Typical tools: Streaming platforms like Apache Kafka, real-time dashboards, and embedded monitoring in ERP systems.
For manufacturers, operational BI is often built directly into production systems. APPIT's FlowSense manufacturing ERP, for instance, surfaces real-time shop-floor metrics so plant managers act on live data rather than yesterday's report.
Strategic BI
- Example: A leadership team reviews three years of market, cost, and margin trends to decide whether to expand into a new state or launch a new product line.
- When to use it: For annual planning, board reporting, market expansion, and investment decisions.
- Typical tools: Enterprise data warehouses, executive dashboards, and consolidated scorecards.
Self-Service BI
Self-service BI empowers non-technical business users to build their own reports and explore data without waiting on IT or data teams. This is one of the most transformative shifts in modern analytics.
- Example: A marketing manager builds a campaign-performance dashboard using drag-and-drop tools, filtering by region and channel, without writing a single line of code.
- When to use it: When you want to scale analytics across departments and reduce bottlenecks on central data teams.
- Typical tools: Microsoft Power BI, Tableau, Qlik Sense, and ThoughtSpot.
Self-service BI succeeds only with strong governance. Without shared definitions and data-quality controls, teams end up with conflicting numbers — the classic "my dashboard says X, yours says Y" problem.
Embedded BI
Embedded BI integrates analytics directly inside the applications people already use, rather than forcing them into a separate BI tool. Insights appear in context, where decisions are actually made.
- Example: A sales rep sees an AI-generated lead score and next-best-action recommendation inside their CRM, without ever opening a separate analytics platform.
- When to use it: When you want to drive adoption by meeting users in their existing workflow — CRMs, ERPs, and customer portals.
- Typical tools: Embedded analytics SDKs, Power BI Embedded, and custom-built analytics layers within business applications.
Mobile BI
Mobile BI delivers dashboards and alerts to smartphones and tablets, enabling decisions on the move — essential in a mobile-first market like India.
- Example: A regional sales head reviews daily targets and receives an alert about an underperforming territory while travelling between client meetings.
- When to use it: For field teams, distributed operations, and executives who need insight away from their desks.
- Typical tools: Native mobile apps from Power BI, Tableau, and custom responsive dashboards.
Choosing the Right Type of Business Intelligence
Selecting among the types of business intelligence is less about picking one and more about sequencing them sensibly. A practical roadmap looks like this:
- 1Establish descriptive and diagnostic BI first. Clean data, trusted dashboards, and shared metric definitions are non-negotiable foundations.
- 2Match delivery style to audience. Give operations teams real-time BI, executives strategic BI, and departmental users self-service tools.
- 3Layer in predictive analytics once your data pipelines are reliable and your team can act on forecasts.
- 4Reserve prescriptive analytics for high-value, repeatable decisions where optimisation genuinely pays off.
- 5Embed insights where work happens to maximise adoption, rather than relying on people to visit a separate tool.
The most common mistake is jumping to advanced AI-driven analytics before the basics are solid. Predictive models built on messy data simply produce confident-sounding errors.
How AI Is Changing Business Intelligence
Artificial intelligence is redrawing the boundaries between these types of business intelligence. Several shifts stand out:
- Natural-language querying. Users can now ask questions in plain English — or Hindi — and receive charts and answers instantly, collapsing the gap between self-service BI and everyday conversation.
- Automated insights and anomaly detection. AI proactively surfaces unusual patterns, so teams no longer have to know what to look for in advance.
- Augmented analytics. Machine learning suggests relevant correlations, forecasts, and next steps automatically, accelerating both diagnostic and predictive work.
- Conversational and generative BI. Large language models turn dashboards into dialogues, letting users interrogate data, request summaries, and generate narratives on demand.
The net effect is that BI is moving from static, backward-looking dashboards toward proactive, conversational systems that not only report what happened but explain why, predict what is next, and recommend action. For many Indian enterprises, this lowers the barrier to advanced analytics: teams that once needed data scientists for every forecast can now access predictive insight through natural-language tools.
That said, AI raises the stakes on data governance, security, and explainability. A recommendation is only as trustworthy as the data and model behind it — which is why disciplined data foundations matter more, not less, in the AI era.
Bringing the Types of Business Intelligence Together with APPIT
Understanding the types of business intelligence is the first step; implementing them coherently is the real challenge. Most organisations end up with a patchwork of disconnected tools — a descriptive dashboard here, a predictive experiment there — with no unified data foundation.
At APPIT Software Solutions, our Vidhaana AI and business intelligence platform is built to span this full spectrum, from descriptive reporting to predictive and prescriptive analytics, delivered through operational, self-service, and embedded interfaces. Combined with our data analytics services and commercial intelligence services, we help enterprises design a BI roadmap that matches their data maturity rather than overreaching. You can explore our broader product suite or read more analytics guides on our blog, and learn about our approach on the about page.
The right BI strategy is not about deploying every type at once — it is about deploying the right type, for the right audience, at the right level of maturity, on a foundation of clean and governed data.
Ready to build a business intelligence strategy tailored to your organisation? [Contact APPIT Software Solutions](/contact) to discuss how the right mix of descriptive, predictive, and AI-driven BI can turn your data into decisions.